
The switch said slow down, and the Pi said yes

The player dropped to 26 fps with three outputs and nobody on the Pi was guilty: cool SoC, idle CPU, a near-empty gigabit link. The culprit was a polite Ethernet feature from 1997, arriving 130 times a second from the cheapest box in the rack. This is the diagnosis, in the order it actually happened, and the one-line fix that now ships baked into the image every new unit is built from.
Three outputs, half the frames
The desk Pi drives three output devices on three protocols: a current-gen pole on bigPacket, the legacy 2018-2023 profile on sACN, and the bench pole on DDP. All three are multicast. With all three enabled, the engine reported 26-30 fps. Disable any two: 60 fps. Re-enable: back down. Perfectly repeatable, and it used to run all three at 60.
The two obvious theories died in the first five minutes, on numbers, not
vibes. Thermal: 69 °C at the full 1.8 GHz clock, with no active throttle
flags. Historical flags said under-voltage and throttling had occurred
sometime since boot, a separate item for the desk PSU. CPU: the engine at
43% of one core with the system 95% idle, no swap traffic. Bandwidth:
/proc/net/dev deltas showed about 5.6 Mbps and 625 datagrams per second
leaving eth0, on a link that negotiated 1 Gbps full duplex. Nothing about a
Pi pushing 0.6% of its link explains a halved frame rate.
The profiler names the stage
The engine keeps a low-overhead stage profiler around its render loop,
drained over HTTP as percentiles per stage (the same instrument from
Anatomy of a frame). One five-second window
with all three devices active settled it. Every compute stage was ordinary:
background 0.7 ms median, source 0.5 ms, geometry microseconds. Then
wire_send, the stage that is nothing but the UDP sendto() calls:
- p50: 151 µs. Healthy.
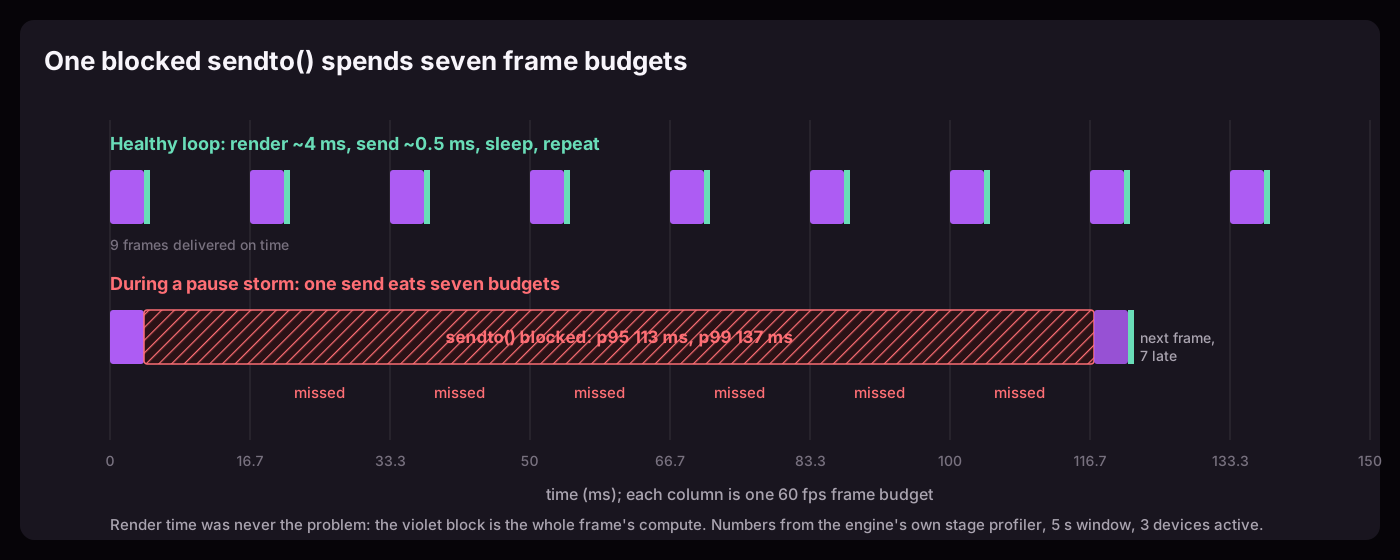
- p95: 113,727 µs.
- p99: 136,984 µs.
The median send was fine and the tail was 113.7 milliseconds. That shape is not "the network is slow." That shape is "the call occasionally does not return." The render loop makes those calls inline, so when one blocks for seven frame budgets, seven frames simply do not happen. 130 frames and 24 deadline misses in the window: 26 fps, observed at the loop's own clock.
Who was blocking the kernel
On a blocking UDP socket, sendto() can wait when the kernel has no space to
accept another datagram. At 625 packets per second, ordinary load should not
do that. The next question was why the transmit path had stopped draining,
and dmesg answered first:
NETDEV WATCHDOG: eth0 (bcmgenet): transmit queue 0 timed out 3044 ms
The transmit queue sat frozen long enough for the kernel's own watchdog to
fire. Then the NIC's MAC counters (ethtool -S eth0) gave up the culprit:
rx_pause: 2399708
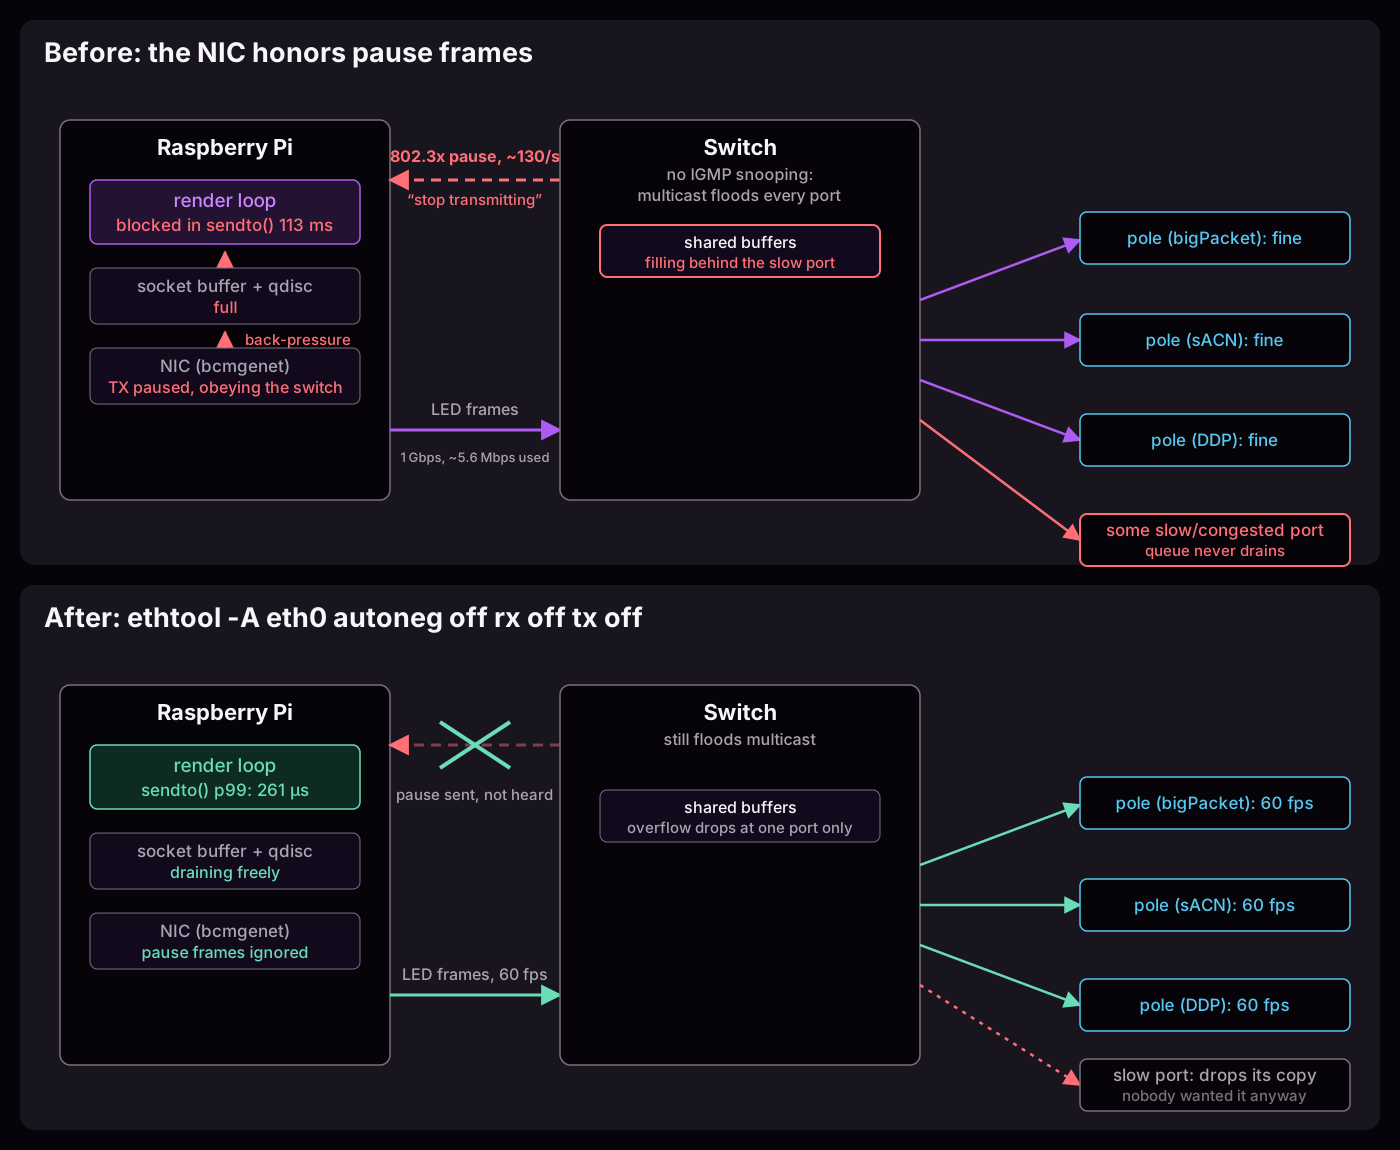
2.4 million IEEE 802.3x pause frames received since boot, and sampling the counter live showed about 130 more arriving every second. A pause frame is the switch telling its link partner "stop transmitting for a while." The Pi's NIC was obeying, every time, all day.
Why a mostly idle switch was begging for mercy
This is the inference step, so naming it as one: all three outputs are multicast, and a switch without working IGMP snooping does not know which ports subscribed to a group, so it floods every multicast packet out every port. Somewhere on this switch is a port that cannot drain its copy of that flood: a slow device, a congested uplink, it does not matter which. Its egress queue backs into the switch's shared buffers, the buffers fill, and the switch defends itself by pausing the loudest talker: the Pi. The pause stalls the entire TX path, not just the packets bound for the sad port. The sACN pole's traffic, the DDP pole's traffic, everything waits behind one stranger's full queue.
That also explains the cleanest symptom of the whole incident: fewer active outputs means less multicast to flood, fewer full buffers, fewer pauses, and the loop makes its deadline again. The frame rate was being set by a device that was not one of the configured outputs.
The fix is refusing to listen
Ethernet PAUSE can be useful when loss costs more than latency. LED frames make the opposite trade: a late frame is worthless, and one dropped frame is usually invisible because sixty new ones are coming every second. For this workload, dropping at the congested port beats stalling the source, so the fix is one line. What it does not do is remove the congestion: it relocates the cost onto whatever sits behind that port, and the rest of this post is the bill for that.
ethtool -A eth0 autoneg off rx off tx off
autoneg off is not decoration. With pause autonegotiation left on, the
next link flap quietly renegotiates flow control back on and the stall
returns with no log line anywhere. The bcmgenet driver accepted the stricter
setting without even bouncing the link.
Effect, same five-second trace windows, same three devices:
Making it stick on a machine designed to forget
This Pi boots from a read-only image with a tmpfs overlay: anything written
to /etc evaporates on reboot, by design, because customer units are imaged
from it. So the fix became a tiny systemd oneshot
(pfx-eth-no-pause.service, bound to the eth0 device, runs the ethtool line
at boot) and was written through the overlay into the real root partition
using the documented remount-rw procedure, with the reboot immediately after
to close the window where the root partition is writable.
The reboot doubled as the proof on this Pi: the unit ran at boot, ethtool -a
showed pause fully off, and the profiler read 299 frames per 5 seconds with
zero deadline misses. One reboot and one five-second window, which establishes
installation here rather than on every unit, NIC, and venue switch. And
because it lives in the imaged partition, every unit imaged from this Pi now
ships with flow control off. That is the part that
matters beyond the desk: a venue switch with the same flood pattern would
produce the same silent collapse, and nothing in the app's UI or logs would
ever name the cause.
The slow port has a name, and a story
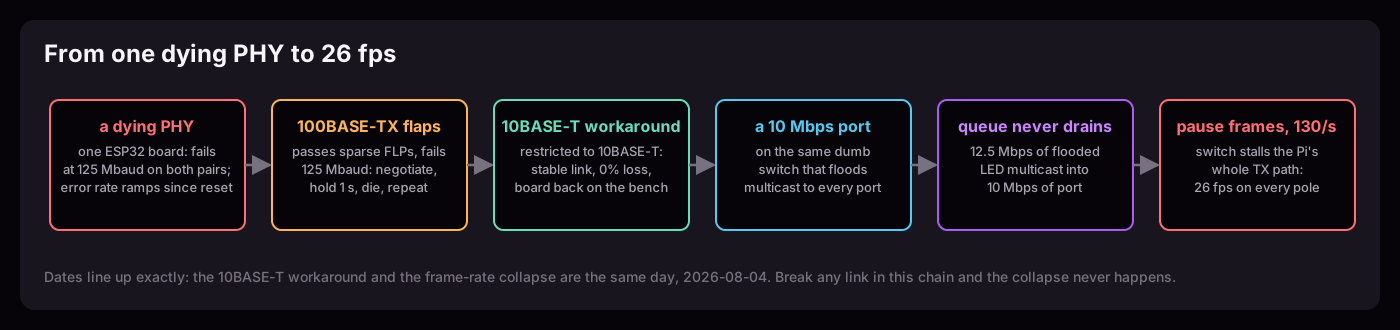
The day the frame rate collapsed is the day another investigation on this same switch dropped a board to 10BASE-T. That was not a coincidence; it was the cause. The full chain deserves telling, because it starts at a failing PHY and ends at the frame rate of every pole on the bench.
"Top Support" is an ESP32 board whose Ethernet had gone unreachable: the console showed the link cycling every ten seconds, forever. That investigation (its own post-worthy saga, recorded in the firmware devnotes) found the ten-second cycle did not exist: ESP-IDF polls the PHY every 2.0 s, the real fault cycle was 2.5 s, and a 2.5-second wave sampled every 2.0 seconds repeats every ten seconds. At the PHY, the shape was distinctive: autonegotiation completed cleanly every cycle, the link came up at 100BASE-TX, and died about one second later. Energy detect never dropped, symbol errors were initially sparse, and the PHY control register stayed constant: software was not restarting negotiation. Autoneg uses sparse Fast Link Pulses; steady 100BASE-TX uses a continuous 125-Mbaud MLT-3 signal. A rate-sensitive transmit fault can pass the pulses and fail the continuous signal, which produces exactly that negotiate-hold-die loop.
The confirming move was restricting the board to 10BASE-T: zero link transitions in 45 seconds, zero packet loss. Degraded, not dead.
The pair-swap sweep sharpened the verdict: the fault is rate-dependent and completely pair-independent. Both MDI and MDIX fail identically at 100 Mbit; both hold perfectly at 10. That acquits every single-part suspect (one bias resistor, one solder joint, one transformer winding) of acting alone and re-ranks the list to common-mode analog: the AVDD network and its ferrite, the bias resistor, the regulator caps, and the PHY chip itself, with nothing yet chosen between them. One asymmetry does favor the chip, and only one: a soft reset of the chip alone resets the drift, which is easier to explain from inside its reset domain than outside it. Freeze spray and a meter on the rails are the next move and neither has been run. The same sweep caught something worse: the board is actively dying. Its 100 Mbit symbol-error rate climbs from ~12 per second just after a PHY reset to ~450-500 per second eight minutes later, falls straight back on a soft reset alone, and is worse day over day at matched uptime. Every reboot makes the board look freshly plausible, which is exactly the failure mode that teaches "works after a power cycle" to mean nothing.
So the workaround that put a flapping board back on the network is what put a 10 Mbps port on the bench switch. The three-output multicast stream measures 12.5 Mbps at 60 fps; the earlier 5.6 Mbps was the same stream throttled down to 26 fps by the stalls. Twelve and a half megabits do not fit through a ten megabit port under any queuing policy. Its egress queue could never drain, the switch's shared buffers filled behind it, and the switch defended itself the polite way: by pausing the Pi. One dying PHY on one board set the frame rate of every pole on the bench.
One measurement from that night does not survive scrutiny, and it is worth naming which: a ping through the drowned port that came back 67% lost with one to two second round trips looked like live proof of the backlog, but it was taken while the pair-swap sweep was actively forcing the board through deliberately broken link modes. It proves nothing by itself. The arithmetic above carries the identification without it.
The other loose thread was a latency floor. Pings to that board at 10BASE-T came back at a fixed ~170 ms, and it did not behave like congestion: invariant to packet size, rate, and protocol, sitting under the board's whole stack (UDP and TCP as much as ping), board-local (a healthy pole on the same switch answered in ~2 ms), and quantized at exactly one 60 fps frame period, as if packets were being released on the tick of a 60 Hz clock. Three suspects: the dying PHY, 10 Mbit mode itself, and the diagnostic firmware build.
None of them. A 2x2 measured from the bench Pi, which shares the switch with the pole, 80 pings per cell, splits it cleanly. 10 Mbit on a quiet network is 0.528 ms. The full flood at 100 Mbit is 0.396 ms. Only the combination produces a floor at all, 25.6 ms in that cell. It is an interaction, not a main effect, and the "floor" was this same multicast flood the whole time. The bench carries 16.79 Mbit/s of unsubscribed multicast, the desk player's ~12.5 plus a second player's ~4.3, counted at the Ethernet frame boundary so preamble and interframe gap are not even in it. That is at least 17% of a 100 Mbit link and at least 168% of a 10 Mbit one. The 60 Hz quantization that read as a receiver-side clock was the flood's own 60 fps cadence refilling the port queue.
The reason the flood looked absent while that floor was being measured is the dullest kind of instrument error: the quiet-check ran on an interface that could not see it. A tcpdump on the wrong side of a dual-homed machine testifies with total confidence about a wire it is not attached to.
The last arm exonerates the damaged board for the latency in this story. With the flood switched off and nothing else touched, the dying board answers in 0.58 ms from the bench Pi, and the ~274 ms returns the moment the flood does. Its transmit fault is real and still awaits repair, but it cost nothing measurable in round trip time at 10 Mbit in any traffic state tested; its only contribution here was providing the 10 Mbps port for the flood to saturate. That is an acquittal on latency, not on the fault, and it says nothing about what the board does at 100 Mbit, where it cannot hold a link for a second at a time. The practical rule that falls out: with the three outputs running, that board is effectively unreachable, so PHY work on it means pausing the outputs or moving it off this switch.
So the flood is the villain twice over. Into gigabit ports it recruits the switch's own pause frames to stall the source. Into a 10 Mbit port it is the latency floor itself. Both failures have the same offered load underneath them.
What is still true tomorrow
The switch still floods multicast; the flood now drops at the one 10 Mbps port instead of pausing the source. IGMP snooping with a querier would remove the flood itself, and the tally it should close keeps growing: the pause-frame collapse in this post, the fallback pole's latency floor, the damaged board's 274 ms pings, and a separate latency pedestal on the trunk. Four incidents, one unset switch feature.
That is the weakest joint in this post, so it gets said plainly rather than buried: nobody has had that switch's admin interface, so snooping has never been enabled or tested here. The diagnosis is measured. The cure is reasoned. Three of the four follow directly from the flood-off arms, because stopping the senders is already measured to clear them. The fourth, the trunk pedestal, is the shakiest: its mechanism is still open, and a switch-side multicast rate limiter, storm control by its usual name, is a live candidate for it. That would be a second and separate way for a switch to mishandle exactly the traffic our shows are made of, and it would not be cured by snooping alone. Until someone logs in, turns snooping on, and watches the poles keep receiving their frames, this is a prediction with good evidence behind it, not a fix. The full measurement set is in the firmware devnotes, 2026-08-05, "the 10 Mbit floor is the flood".
Also open: one eyebrow raised at the desk PSU for the recorded under-voltage and throttling history flags, and the board fault underneath it all, a hardware repair waiting to happen on a part not yet identified.
The firmware feature born from the same saga, an automatic loud fallback to 10BASE-T after repeated link flaps, is no longer hypothetical: it has been verified live on this very board, declaring itself degraded about 33 seconds after boot and then holding a stable link through the rest of the night's work. Hours, not a soak. It means the fleet will eventually create 10 Mbps ports on venue switches on purpose. That is the right robustness trade, and it is also exactly the setup for this incident. There is no mode-intrinsic penalty to worry about: a pole that falls back on a well-behaved network pays half a millisecond, not 170. What it cannot survive is falling back onto a port that is already over capacity with traffic it never asked for, which is what every unsnooped switch offers it. So the rollout gate is a single item, and it is the one this post is about: the fleet's Pis must stop honoring pause frames before any pole is allowed to fall back. Every imaged Pi already ships deaf to them; the existing fleet needs the same ethtool setting through the update path first.
The keeper lesson is about instruments. The app's own logs had nothing. CPU,
temperature, and bandwidth all testified for the defense. The story lived in
three places nobody looks: a per-stage percentile in the engine's profiler,
a kernel watchdog line, and a MAC counter that only ethtool -S bothers to
read. The median said healthy; the p95 said everything.