
Anatomy of a frame
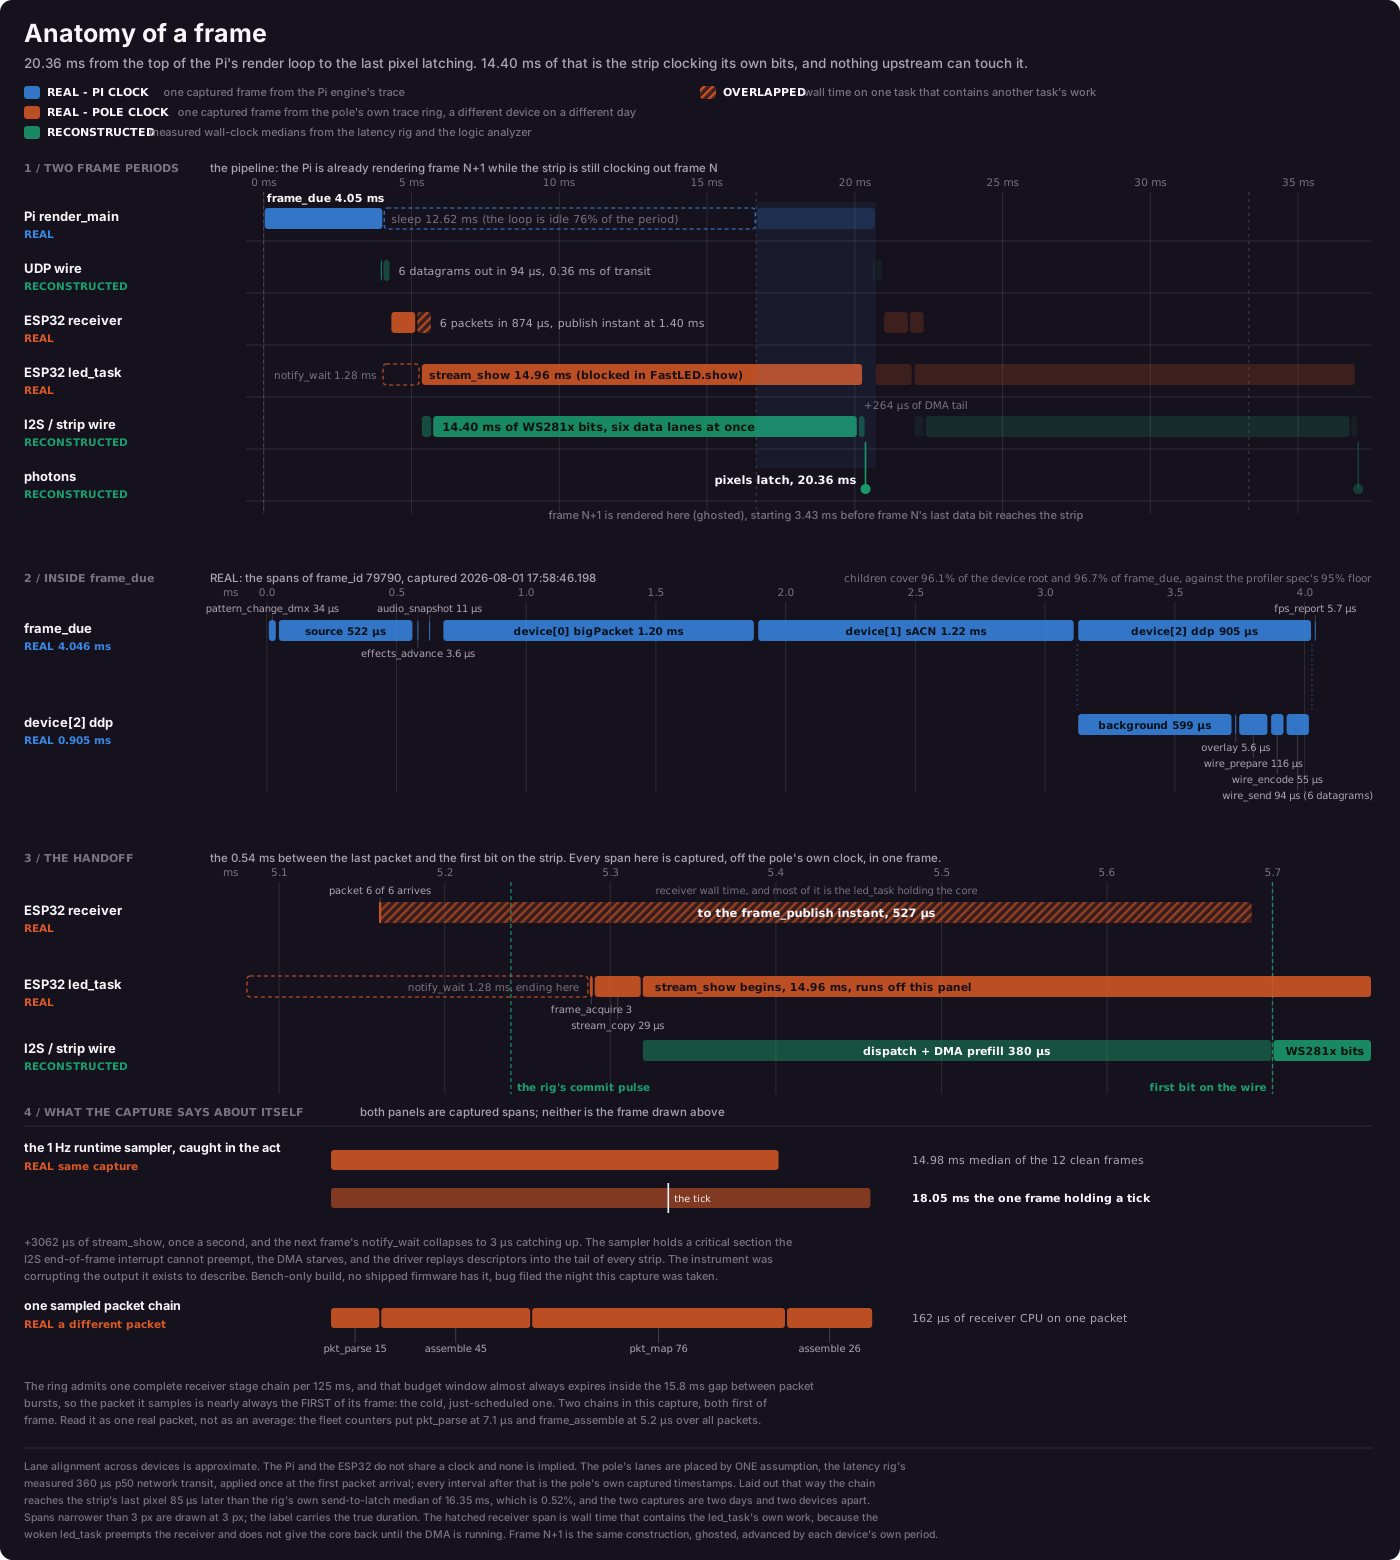
One 60 fps frame drawn across every owner that touches it: the Pi's render loop, the network, the pole's receive task, its LED task, the strip's own wire protocol, and the instant the pixels change. Three of the six lanes are now captured frames rather than reconstructions. The figure says which is which, and which clock each one came off.
Three instruments and no picture
We spent weeks measuring pieces of this path and never once looked at all of it at the same time.
The Pi engine got a per-frame stage profiler that drains Chrome Trace JSON over HTTP, so we can see what the render loop did on any given frame. The pole published its own stage counters every five seconds, so we knew what its receive task and its LED task cost on average. A logic analyzer with four signals on one timebase gave us send to latch on real hardware. Each instrument measures at a different boundary and none of them shows a frame.
The first version of this post put them on one axis anyway, with five of the six lanes drawn from averages and medians. Two days later the pole grew a trace ring of its own, and the two ESP32 lanes became real. This is the version with the pole's own timestamps in it.
Where the time goes
The render loop wakes, decides a frame is due, and spends 4.05 ms on it. Most of that is not our pole: this Pi drives three outputs on three protocols (bigPacket, sACN, DDP) and the one we are following is third in the list. Its own slice is 905 µs, of which 599 µs is compositing the background and 94 µs is the six datagrams going out the socket. Then the loop sleeps for 12.6 ms. At 60 fps the engine is idle 76% of the period.
The first datagram reaches the pole 360 µs later. That number is the only thing holding the two halves of this picture together, and it comes from the logic analyzer, not from either trace. It also comes from a bigPacket cell rather than this DDP stream, which is the one place the figure splices two protocols together. More on what that costs below.
From there the pole speaks for itself. Six packets land over 874 µs, at a
steady 160 to 225 µs apart, which is the Pi's send pacing showing up on the far
end of the wire. 126 µs after the last one, the LED task claims the frame
(3 µs), copies it (29 µs), and calls FastLED.show().
The receiver's frame_publish instant does not appear until 527 µs after that
last packet, by which time the LED task has been inside FastLED.show() for
367 µs. Read that ordering again. The task that publishes the frame finishes
publishing it after the task it woke has already started clocking it out.
381 µs after show() is entered the first bit is on the wire. From there it is
14.40 ms of nothing but WS281x bits: 480 pixels, 24 bits each, 1.25 µs per bit,
six data lines clocking in parallel. Add 264 µs of DMA ring tail and the pixels
change.
20.36 ms, top of the render loop to last pixel. 14.40 ms of it is the strip talking to itself.
The picture also shows why none of this is a latency problem. It is a pipeline. Laid out this way, the Pi starts rendering frame N+1 3.43 ms before frame N's last data bit reaches the strip, so at the moment N latches, the engine is already 3.7 ms into N+1. Both of those are arithmetic across the 360 µs anchor rather than a pair of events anybody watched together, so both carry its few-hundred-microsecond uncertainty. The overlap is ten times that, so the pipelining survives it.
The handoff, now that we can see it
The old version of this figure drew frame_publish as a 436 µs bar and argued,
by subtraction, that almost none of the 436 belonged to the receiver. The
capture just shows it.
frame_publish is stamped when pfxPublishStagedFrame() returns. In between,
the notify wakes a higher-priority task on the same core, and the receiver does
not run again until that task has claimed the frame, copied it, and started the
DMA. So the instant lands after stream_show has already begun, on a
different task's lane, every frame, by 367 to 382 µs across the capture. You
can see the preemption as a gap rather than infer it from an average.
The logic analyzer's commit pulse fires inside pfxPublishStagedFrame(), 79 µs
after the last packet on the rig's bigPacket cell. The trace brackets the same
region at 112 µs from last packet to frame_acquire. The pulse has to land
inside that interval and it does, with 33 µs left over for the notify and the
context switch. Two instruments, different protocols, different builds,
consistent.
What is real here and what is not
Three lanes are captured frames. Three are still drawings.
The Pi lane is frame_id 79790, captured at 17:58:46.198 on 2026-08-01, picked
because its frame_due duration is the exact median of the 299 frames in the
window. The drain that read it is read-only: it does not stop the engine, and
the window had zero deadline misses.
The two ESP32 lanes come from hardware_bench_pole.bin, the first trace this
project ever pulled off a pole: PFX_TRACE=1 build ece99ceb, boot 0xE6145AB6,
generation 12, under a live 60 fps DDP stream. The whole capture is 254 ms and
holds 15 displayed frames. Twelve of them are usable: the sampler damages two
(see below), and the first frame in the window has no notify_wait,
frame_acquire or stream_copy of its own inside the ring. The frame drawn
here is the one whose stream_show sits nearest their median, the same rule
the Pi lane uses.
The UDP wire, the strip wire, and the photons are still reconstructions from the latency rig and the logic analyzer. Nothing on the pole can see its own data pin.
And the two devices still do not share a clock. The pole's lanes hang off one measured number, the 360 µs network transit, applied once at the first packet arrival. Every interval after that is the pole's own timestamps and is exact to the pole's own clock. The offset between the two devices is an assumption, and a few hundred microseconds is the best it will ever be. The profiling spec is explicit that a cross-device figure must never imply a synchronization that does not exist, which is why the two captured lanes are two different colors instead of both being blue.
The instrument was breaking the thing it measured
The fourth panel is the capture describing its own build, and it is not flattering.
One of the 15 frames has a stream_show of 18.05 ms against a median of
14.98 ms. Inside that frame sits the trace's single task-runtime sample. The
sampler runs one uxTaskGetSystemState pass per second inside a critical
section, the I2S end-of-frame interrupt cannot preempt it, the DMA ring starves,
and the driver's response is to replay descriptors: it inserts pixels into a
frame whose pixel budget is fixed, so the tail of every strip is displaced at
once. Spencer saw it at the bench the same night, described as glitching every
couple of seconds on all strips, confined to the ends. The counters agreed:
0.797 late events per second against exactly zero on the release image on the
same board in the same session.
The next frame's notify_wait collapses to 3 µs, because its data was already
waiting by the time the LED task got back. One tick, two damaged frames, and
both are out of the twelve. Nothing here proves the frames after those two are
clean; they only look ordinary.
This is a bench-only build. PFX_TRACE is 0 in anything that ships, no
customer pole has the sampler, and the release image measures zero late events
and zero replayed pixels. But it is worth stating plainly: the first hardware
runs of this tracer were corrupting the output it exists to describe, and the
capture in this post is one of them. The runtime lane is real data. It is not free
data, and this post does not show it as a lane.
The other half of that panel is the same lesson in miniature. The trace admits
one complete receiver stage chain per 125 ms. That budget window almost always
expires during the 15.8 ms gap between packet bursts, so the packet it samples
is nearly always the first of its frame: the cold, just-scheduled one. Both
chains in this capture are first-of-frame. Their pkt_parse is 15 µs against a
fleet counter average of 7.13, and their frame_assemble is 45 and 26 µs
against 5.17. pkt_map is bulk memory work, bound by bandwidth rather than by
cold code, and it agrees to 3.5%. Two samples prove nothing. The sampling rule
does, and it is the kind of bias that passes for a measurement until somebody
asks where the sample came from.
Where the lanes agree, and where they don't
The lanes were placed by arithmetic on measured numbers, so they either close or they do not. Eight of them compare the new capture against the five-second aggregate counters the old version of this figure was drawn from, which is the first time those two instruments have been checked against each other at all.
| Check | One side | Other side | Difference |
|---|---|---|---|
| Pole display period | 16,670 µs (captured, 11 clean intervals) | 16,666.22 µs (stream_period counters, 184,880 frames) |
+3.8 µs |
| Pi frame period vs the pole's | 16,666.19 µs (Pi trace, 298 intervals) | 16,670 µs (pole trace) | +3.8 µs, two free-running clocks |
| Datagrams per published frame | 6.0000 exactly (90 packet instants, 15 publishes) | 6.0002 (the pole's own packet counters) | +0.0002 |
stream_show |
15,031.8 µs (12 clean captured frames) | 15,047.20 µs (counters) | −15.4 µs, 0.10% |
stream_copy |
28.6 µs (captured) | 25.65 µs (counters) | +2.9 µs |
frame_acquire |
4.9 µs (captured) | 5.78 µs (counters) | −0.9 µs |
notify_wait |
1,485 µs (captured, 12 frames) | 1,566.21 µs (counters) | −81 µs, and it is blocked time, so it absorbs everything else |
| Loop overhead no span covers | 16 µs (captured period minus its four stages) | 21.38 µs (the same subtraction on the counters) | −5.4 µs |
frame_publish wall time |
405 µs (captured, frame_acquire to the publish instant) |
435.98 µs (counters, around the swap) | −31 µs, and the two do not start at the same edge |
| Last packet to the LED task's claim | 112 µs (captured median) | 79 µs (the rig, last rx to the commit pulse) | the pulse lands 33 µs inside the captured interval, where the notify has to be |
| Socket drain window | 946 µs (captured median, first to last packet) | 839 µs (the rig, first rx pulse to last) | +107 µs, and see below |
| Strip activity span vs bit arithmetic | 14,663.4 µs (logic analyzer) | 14,400.0 µs (480 × 24 × 1.25) | +263.4 µs, 211 bit times against a measured DMA tail whose median is 228 bits |
| Reconstructed send to latch | 16,436.3 µs | 16,351 µs (rig p50) | +85.3 µs, 0.52% |
| Reconstructed commit to latch | 15,123.3 µs | 14,930 µs (rig p50) | +193.3 µs, 1.29% |
| The rig's own segments summed vs its own end to end | 16,208 µs | 16,351 µs | −143 µs |
Six of the eight capture-versus-counter rows agree within 16 µs. The other two
are notify_wait, which is blocked time and therefore absorbs every other
variation in the loop, and frame_publish, where the two instruments do not
start at the same edge. So two instruments built two days apart, one averaging
over 184,880 frames and one recording individual spans, tell the same story
about what the pole does with a frame. That is the row of the table we actually
came for.
The two rows involving the rig do not close, and both are the same problem as last time, only now it is easier to name. The rig's c0 cell is bigPacket at 2,880 pixels in a different firmware build; the capture is DDP. bigPacket arrives in a different number of datagrams on a different send cadence, which is most of the 107 µs on the drain window, and the copy path is not the same code. The DMA tail is also bimodal, with 38% of frames on a 28 to 40 bit floor against a median of 228, so 193 µs is 154 bit times of a distribution that really is that wide.
The end-to-end residual got worse when the lanes became real, from 26 µs to 85 µs. That is the honest direction. The old 26 was two errors of opposite sign landing on top of each other, which the previous version of this post said out loud at the time.
Every number and where it came from
| Number | Value | Measurement boundary | Source |
|---|---|---|---|
| Pi stage spans, frame 79790 | see figure panel 2 | engine render thread, one monotonic clock, both marks in manage_main_loop/send_pixels |
GET /api/trace?seconds=5 on polefx.local, drained 2026-08-01 17:58:46 local |
| Pi frame period | 16,666.19 µs p50 | same trace, 298 start-to-start intervals | as above |
| Datagrams per frame | 6 | wire_send aux field, DDP device |
as above |
| Pole stage spans, one frame | see figure panels 1, 3 | ESP32 C-lite trace ring, esp_timer_get_time(), marks shared with the Part B counters |
pfx-firmware tools/trace/golden/hardware_bench_pole.bin, build ece99ceb, boot 0xE6145AB6, generation 12, 2026-08-02 |
| Pole capture window | 253,988 µs, 256 records, 15 displayed frames | one frozen ring generation | as above; trace_convert.py --stats |
| Pole display period | 16,670 µs median | stream_show start to start, 11 clean intervals |
as above |
| Sampled packet chain | 15 / 45 / 76 / 26 µs | one admitted packet's own stage boundaries | as above; two chains in the capture, both first-of-frame |
| Sampler footprint | +3,062 µs on one stream_show |
the frame containing the 1 Hz runtime tick | as above; bug 2026-08-02-trace-runtime-sampler-blocks-i2s-eof-isr |
| Network transit (S1) | 360 µs p50 | Pi GPIO after sendto() to ESP32 GPIO in the UDP receive loop |
2026-07-31-lat-rig-first-cells.md, c0 cell, bigPacket, 3,600 frames |
| Socket drain | 839 µs p50 | first receive pulse to last receive pulse | as above |
| Last packet to commit (S2) | 79 µs p50 | receive pulse to the commit pulse in pfxPublishStagedFrame() |
as above |
| Commit to latch (S3+4) | 14,930 µs p50 | commit pulse to the LED data line | as above |
| Send to latch, end to end | 16,351 µs p50, 16,683 p95 | Pi GPIO to LED data line, one analyzer timebase | as above |
pkt_parse / pkt_map / frame_assemble |
7.13 / 78.22 / 5.17 µs per span | pole's own counters, receive task, DDP owner | PoleFX_frameprof lines in captures/2026-07-31-c3-rerun/, 400 windows, 184,880 frames |
frame_publish |
435.98 µs | receive task wall time around the staging swap and notify | as above |
notify_wait / frame_acquire / stream_copy |
1,566.21 / 5.78 / 25.65 µs | LED task, blocked time reported as cadence, not CPU | as above |
stream_show |
15,047.20 µs | LED task, FastLED.show() through EOF |
as above; parity against the legacy instrument at 15,040.2 vs 15,043.3 µs (B5.1) |
stream_period |
16,666.22 µs | LED task, measured start to start, never summed | as above |
| Strip activity span | 14,663.4 µs mean, 1,801 bursts | LED data pin, FX2 logic analyzer at 8 MHz, 30 s | B5.2 in frameprof-b4b5-matrix-2026-07-31.md |
| Show-to-analyzer offset | +380.9 µs, spread 56.9 µs | stream_show minus the analyzer activity span |
as above; this is the figure's dispatch bar |
| WS281x wire time | 14,400.0 µs | arithmetic: 480 px × 24 bits × 1.25 µs | the geometry, cross-checked at 11,520 pulses per lane per frame |
| DMA replay tail | median 228 bits, p95 498, 38% on a 28-40 bit floor | LED data pin, 1,799 frames | B5.2 |
Two quantities on the figure are still derived rather than measured, and each
is one subtraction: the 381 µs dispatch is stream_show minus the analyzer
activity span, and the 263 µs tail is that span minus the bit arithmetic.
The figure is drawn by blog/figures/generate_anatomy_of_a_frame.py, and every
coordinate in the SVG falls out of the numbers above by arithmetic. Nothing was
nudged to make it read better, which is why two rows of the table visibly do
not close and why the end-to-end residual got worse rather than better. The
interactive version reads spans.json, which
blog/figures/generate_anatomy_spans.py builds by importing that same module,
so the two pictures cannot drift apart and the tooltips quote the table above
rather than paraphrasing it.
What is left
Both traces open in Perfetto as they are. There is now a tool that merges them
into one file with the anchor and its error bar written into the metadata, so
nobody has to take the alignment on trust. Ten-line recipe in
pfx-proto/specs/trace-to-perfetto-howto.md.
The green lanes are going to stay green. The pole cannot see its own data pin,
so the logic analyzer remains the only direct measurement of anything
downstream of FastLED.show(), and no amount of software tracing changes that.
It watches an edge on one probed data line, not a photon: the last hop, from a
driven pin to emitted light, is nobody's measurement in this post. What the next
bench session can fix is the sampler: compile it out, take the capture again,
and the orange lanes stop carrying a footnote.
Measured on the desk Pi (three output devices, 60 fps) and the bench pole: ESP32 on wired Ethernet, six data lines of 480 SK6813MINI pixels each. Both traces were drained read-only over HTTP. Nothing was flashed, restarted, or rebooted for this post; the pole capture was taken during an earlier qualification run and committed to the firmware repo as a test fixture.