
Teaching a pole to tell time

Four days ago, "how long does a frame take?" meant a frame-rate counter and a chain of inference. Now the pole measures each stage, broadcasts the result every five seconds, and gets checked automatically at 04:10. Building that instrument exposed more measurement failures than firmware failures.
The mean described no real frame
Three instruments and an arbiter agreed on the idle loop: 16.739 ms per frame, 59.74 fps, 0.43% slower than streaming. All four numbers were arithmetically right, and all four described the machine badly in the same way.
Ninety-seven percent of frames sat in report windows averaging exactly 16.667 ms; the rest sat in six windows averaging near 19.3 ms. The reported 16.739 ms average described neither group, and no frame actually ran at that time.
The distribution was bimodal. Of 219 five-second report windows, 213 averaged
16,667.0 microseconds and carried 97% of the frames; six averaged 19.3 ms. (No
individual frame runs at 16,667 either. They alternate 16 and 17 ms and the
pacer's quantization cancels.) The entire average excess of 70 microseconds per
frame sat in those six windows, 766 milliseconds of excess apiece, every one of
them the aurora→silksheen crossfade. Its frames compute in 62.35 ms against
a 16.667 ms budget for the whole one-second fade, so the render task misses the
LED task's 50 ms handoff, about 45 frames are dropped, and the pole hitches for
three quarters of a second once every three minutes. The mean described a frame
that never occurred.
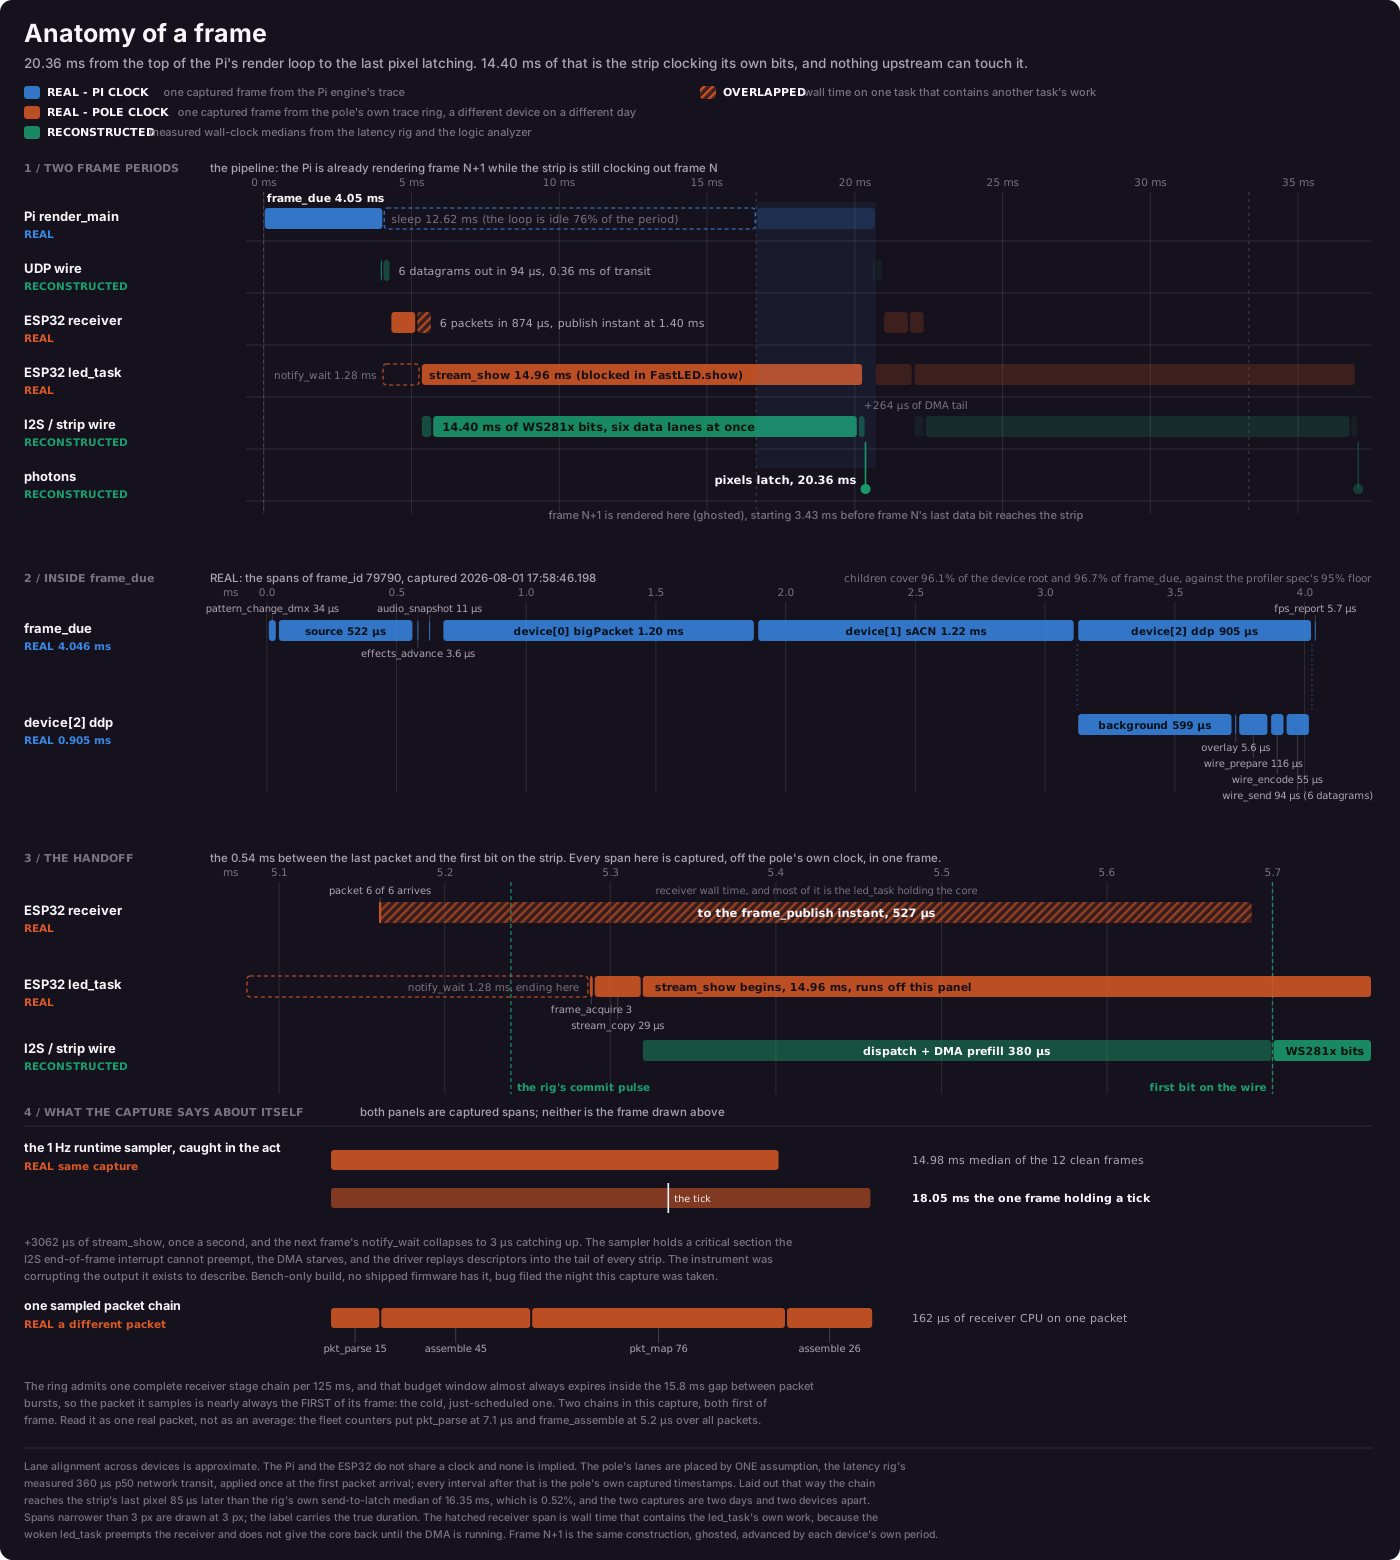
That became the campaign's theme. Nobody was sloppy: the instruments were fine at what they measured. They measured aggregates, and the defect did not live in the aggregate. The resulting tracer is shown in Anatomy of a frame; this is what its four-day build taught us.
Frame rate cannot price work on a paced system
The Pi drives the pole at exactly 60 fps. The LED task works, then blocks in
notify_wait for the next packet. Add five microseconds of profiling and the
wait simply becomes five microseconds shorter. Frame rate does not move.
The noise on that wait was ±230 microseconds; the expected profiler cost was 5–13. An end-to-end A/B would correctly report no significant frame-rate difference, which is both true and worthless, and we would have shipped on it.
So we calibrated each operation, counted invocations, and multiplied:
esp_timer_get_time(): 0.518–0.590 microseconds.pfx_prof_add(): 424.4 ns with a histogram, 180.5 ns without. The eight-step histogram scan turns out to be the call rather than a rounding term on it.- Streamed frame: six clock reads plus five adds, predicted 5.4 microseconds, measured 5.23–5.66 against a 50 microsecond budget.
- Idle frame: zero reads plus four adds, measured 1.70 microseconds.
We first counted six adds from the design note; the merged code contained five. Calibrate-and-count only works if the count comes from the artifact that ships.
An A/B still answers a separate question: whether enabling the reporting path changes behavior. Cost and behavior need different instruments, and running one at the other's job is how you get a confident number that means nothing.
A control only controls what its switch changes
Our first behavioral A/B convicted the profiler: six randomized pairs produced 50 I2S late events against 4, and 83 replayed pixels against 7, all six pairs in the same direction (sign test p = 0.031).
Both arms also carried an uncached flash read on a ten-second version heartbeat. The profiler reported every five seconds, so every other report coincided with that defect. After the version read was latched, the identical A/B produced zero late events and zero replayed pixels in both arms. The old control was the same defect at half rate. Its 0.27 lates per minute (against roughly 30 expected if its own datagrams were guilty) was the clue the p-value could not explain.
Six days later we made the complementary mistake. A runtime toggle armed only a trace-ring write, while a compile-time task sampler remained active in both arms. The A/B returned a clean null even as the pole visibly lost frame tails once a second. Compiling out the sampler while leaving the rest of the tracer running produced 0 late events and 0 replayed pixels over six minutes, versus 857 and 67,770 with it present.
A result, positive or null, is evidence only about what the switch actually switches. Write that scope beside the result before seeing the result.
There were no clean links, only lucky ones
A release gate caught two idle crossfades computing in 101 ms and 47 ms against a 16.667 ms tier. The source was unchanged; code placement was not.
Across five builds differing only by dead text placed ahead of the pattern block, no flash placement clears the 16.667 ms tier on all three watched crossfades. Rebuilding three placements with pattern text in IRAM puts every state between 5.73 and 10.90 ms.
Five images from one commit differed only by 0, 32, 64, 96, or 140 bytes of dead text ahead of the pattern block. Not one placement was clean on all three crossfades. The same unchanged pattern had already measured 41.59, 41.45, 5.49, and 5.71 ms across four earlier builds, a sevenfold swing from layout alone.
The mechanism was cache-set conflict. Each pixel touched 54 distinct 32-byte lines. The sick build placed three or more hot lines in three two-way cache sets; the control had none. Nine lines were refetched per pixel at about 900 cycles, or 3.8 microseconds each. Model: 34 microseconds of excess. Measured: 31.8.
Even that agreement needs a warning label. The first model overcounted lines and underpriced each refill by similar factors, letting two errors cancel.
The structural fix was main/linker.lf, placing pattern text in IRAM. Sweeping
the whole 34-state registry on three of the same pad builds, 102 state
measurements, the worst frame became 10.90 ms, every state held 60.0 fps, and
overruns fell to zero. That is the pad perturbation defeated on one toolchain
and one board, not a proof against every future layout. Thirty-five checks derived
from the pattern registry ensure new sources join the linker fragment; a
filename glob would miss oddly named patterns.
Every earlier per-pattern idle timing is therefore void as a build-portable fact. It measured one image, not the source.
The instrument captured its own damage
The committed Perfetto trace contains fifteen displayed frames. One
stream_show lasts 18,045 microseconds against a 14,983 median, and the trace's
only task-runtime sample sits inside it.
During that same comparison, Spencer saw glitches across every strip at the ends, about once a second. The matching three-minute arm recorded 150 late events and 12,516 replayed pixels, within 1.5% of its armed partner. Parallel I2S drives every strip from one DMA stream, so equal position on every strip is time within one frame. The visual report and counters described the same defect.
A degraded feed joint could brown one strip, and the deliberately ugly
crossfades could hide artifacts; neither explains every strip failing at one
position. The capture remains published with its stream_show values labeled
void. Known contamination is still evidence when it is labeled.
Percent is not a deadline
The guilty sampler used 0.357% of one core against a budget below 1%. It passed by delivering nearly all its cost in one 3.4 ms kernel-lock hold each second, against a DMA ring buffering 120 microseconds. Average CPU could not see the deadline failure.
The sampler averaged 0.357% CPU and passed its 1% budget, but one 3.383 ms lock hold was about 28 times longer than the DMA ring's 0.120 ms coverage.
The reporting emitter had already shown the same mismatch at a smaller scale: 0.024% measured CPU against a 0.004% estimate, with no information about where those cycles blocked. It took the sampler failure to make the rule explicit.
The new rule is direct: on the LED path, any interrupts-off or required-lock hold longer than the ring coverage fails, regardless of CPU percentage. The sampler fix reduced the median hold from 3,383 to 60 microseconds, and one of 119 holds still read 306, which looked like the instrument breaking its own new rule on the day it wrote it.
Chasing that 306 made it one more instance of this post's subject, because it
was never a lock hold. The sampler stopped its clock one line after
taskEXIT_CRITICAL(), and on this IDF that call releases the spinlock before it
restores the interrupt level, so the deferred interrupt backlog and every
microsecond of descheduling behind it were charged to a hold that had already
ended. Splitting the window at the release put the lock actually held at a 97
microsecond median and a 146 microsecond maximum, 7 ticks of 353 over the line.
That is a real overrun, by tens of microseconds rather than by 2.6x, and the
thing over the line is the enumeration rather than a stall. With the split
merged alongside the IRAM placement change, the bench pole reads 18
microseconds median and 25 for the lifetime maximum across 897 ticks, none of
them over the ring, so the rule is met with 4.8 times the margin rather than
argued about. The IRAM post separates this
blocking failure from cache residency.
Asking "is the clock lying?" was not enough, either. It was asked, and answered
correctly: a cycle counter read beside esp_timer agreed with it to within 1%.
The timer was right and its endpoints were wrong, which is a different question
than the one the check was built to ask.
Two hundred and thirty guesses, scored
We write estimates before measuring them. Four days left 230 in the notes.
The result in one sentence: 141 predictions matched the measurement, 75 did not, and most misses understood the behavior but misjudged its size.
Of 230 predictions, 141 matched the measurement, 75 did not, and 14 were not scored. Of the 75 misses, 57 got the behavior right but its size wrong. Of 13 predictions that named a culprit, none was fully right.
Of 216 testable and tested predictions, 141 held: 65%. The percentage is not a population statistic; the notes mix easy conservation claims with hard guesses. The structure underneath it is more useful:
- 57 of 75 misses had the mechanism right and magnitude wrong.
- Magnitude leaned optimistic: 33 underestimates versus 24 overestimates; all three budget-breaking misses were underestimates on the bench tracer.
- Named culprits went 0 for 13 fully correct: three were partly right and
ten wrong. One assigned 55% to the OTA task in a panic that actually named
emac_rx;otawas not involved. - Code-grounded arithmetic held: the trace ring was predicted at 16,896 bytes plus alignment and measured 16,920; its struct was 16,180 predicted and measured; the geometry knob returned exactly 12,032 bytes; the snapshot was exactly 8,128.
The actionable lesson is to spend fewer paragraphs assigning confidence to a culprit and more time reading the path and writing the arithmetic.
04:10
The nightly bench job now runs at 04:10, only after the Mac has been idle for 15 minutes. It listens for the pole's broadcast, reads counters over HTTP, and checks them without taking the bench lock.
Its dry run observed 19 windows over 95.0 seconds, rejected none, deduplicated 19 repeated datagrams, computed 60.002 fps from the pole's own frame period, passed, and published 1,046 bytes.
It also read stream_show at 15,076.3 microseconds over 5,703 samples. Another
boot an hour earlier measured 15,047.8 over 3,602, a 28.5 microsecond, 0.19%
spread. That earlier leg reproduced a five-week-old measurement on another
build to 3.5 microseconds.
The wire was more repeatable than the software watching it. The hard part was building an instrument honest enough to say so.
Sources live under pfx-firmware/docs/DEVNOTES/: the prediction scorecard,
15 instrument limits, and 44 retired figures in
2026-08-02-e6-frame-profiling-close.md; placement analysis in
2026-08-02-caustics-placement-mechanism.md; the contaminated A/B and rerun in
2026-07-31-b4-frameprof-overhead.md and
2026-07-31-c3-rerun-b5-parity.md; the sampler in
2026-08-02-sampler-fix.md and 2026-08-02-sampler-hold-outlier.md. Timings
are the pole's counters read over HTTP or its five-second broadcast and
differenced across locked bench windows, not a logic analyzer or frame-rate
estimator. The 65% score covers predictions people chose to write down, not a
statistical sample.