
Two extra laps of a four-pixel ring

A flicker you see twice an hour and cannot reproduce. It turned out to be an LED driver's DMA engine re-sending its own buffer while the interrupt meant to refill it was switched off, because a keyword that was supposed to put that interrupt in fast memory had quietly compiled to nothing.
A defect with no evidence
Spencer saw a flash. Not a flicker in the pattern, not a dropped frame, just a momentary sense that the LEDs had jumped sideways and come back. Twice in an hour, maybe three times. Never on demand.
That is close to the worst shape a bug can have: too rare to bisect, too short to photograph, too vague to describe to a tool. One property helped. It lasted about one frame, which pointed hard away from anything that persists (no lease expiring, no mode change, no service restart) and toward a transient somewhere in the output path.
The other thing that helped was luck. It happened while a new strip-order calibration screen was up, on the bench we had just built.
The screen that was accidentally a detector
That screen solves a boring problem: six LED strips plug into the controller and a builder can get the order wrong. Its Identify view lights every column at once so a person can read the physical order off the pole.
The function that draws it never looks at the clock. It produces one frame and sends those same bytes for the whole session.
Which changes the problem completely. In moving content you have to decide how much change is too much, and that means a threshold, and a threshold is a judgment call you will be defending later. Under a frame that never legitimately changes, the detector is equality. Any difference is a defect, and a difference followed by a return to the held frame is exactly the reported symptom. A feature built to make wiring legible turned out to be a purpose-built instrument for a one-frame displacement, and nobody planned that.
Sixteen megahertz, and a splice
We chased this at 8 MHz first and got an answer we withdrew the same day. At that rate a 250 ns pulse is two samples wide, and every frame carried about 55 pulses of 125 ns, which is what 8 MHz sampling looks like when it splits a pulse in two. A displacement that only shows up at your sampling floor is not a displacement yet.
At 16 MHz a zero is 3 to 5 samples and a one is 11 to 13, with real separation. We requested eight million samples, got exactly eight million back, and decoded half a second of all six lanes. One frame was different, in a very specific way. Not corrupted. Spliced.
bad[:222]    == good[:222]
bad[222:246] == good[210:222] * 2
bad[246:]    == good[222:1416]
In pixel terms: pixels 70 through 73 went out three times instead of once. Two extra laps of a four-pixel block inserted eight pixels, shifted everything after them, and pushed the last eight intended pixels off the end of the strip. Correct up to a point, then a short block of pixels that had already been sent appears again, twice, then the rest of the frame continues byte for byte identical to what it should have been, displaced by the length of the insertion.
Here it is in the actual bytes, one lane, GRB as it left the controller:
| wire pixel | held frame | recorded | |
|---|---|---|---|
| 70 | 38,38,38 |
38,38,38 |
the four pixels in the ring, sent as intended |
| 71 | 38,38,38 |
38,38,38 |
|
| 72 | 12,0,17 |
12,0,17 |
|
| 73 | 5,0,17 |
5,0,17 |
|
| 74 | 12,0,17 |
38,38,38 |
second lap begins: pixel 70 again |
| 75 | 5,0,17 |
38,38,38 |
pixel 71 again |
| 76 | 12,0,17 |
12,0,17 |
pixel 72 again, identical by luck |
| 77 | 5,0,17 |
5,0,17 |
pixel 73 again, identical by luck |
| 78 | 12,0,17 |
38,38,38 |
third lap: pixel 70 again |
| 79 | 5,0,17 |
38,38,38 |
pixel 71 again |
| 80 | 12,0,17 |
12,0,17 |
pixel 72 again, identical by luck |
| 81 | 5,0,17 |
5,0,17 |
pixel 73 again, identical by luck |
| 82 | 12,0,17 |
12,0,17 |
intended pixel 74 arrives here, and so does the rest of the frame |
Line noise reproducing a previous block exactly and then resuming in perfect alignment is not a serious hypothesis. The overwhelmingly likely reading: something re-transmitted data it had already sent.
Worth noticing what the table does to a difference count. Eight pixels were inserted, but only four of them hold a different value than the pixel they displaced, because this screen's dot pattern repeats every four pixels and the replay is four pixels long. Counting differing bytes understates the insertion, and on two of the six lanes the coincidence went all the way: every replayed pixel happened to match, so those frames were byte-identical and those lanes looked clean. They were not clean. They were lucky, and reading that as evidence that only some lanes were affected cost us time twice.
The repeated block gave away where. This driver hands the bitstream to a circular list of four DMA descriptors, each holding one pixel, and refills each one from an end-of-frame interrupt as the hardware drains it. If that interrupt does not run in time the DMA engine does not wait. It reaches the end of the list, wraps, and sends whatever is still sitting there. The insertion was the ring, replayed. The capture held two extra laps of it.
That felt like the answer. It was half of one: we knew what the hardware did, not why the interrupt was late.
The attribute that compiled to nothing
The handler is declared with ESP-IDF's IRAM_ATTR, which is supposed to place a
function in fast internal memory so it can run while the flash cache is disabled.
Directly above the line that registers it, the upstream driver carried this
comment for years:
this seems to work great with the default 0 flag, but everything is in IRAM so why not raise it a little? Because you'll get a panic, and I'm not sure why.
Both halves are wrong, and the reason is the bug. Read the built binary instead of the source:
$ nm firmware.elf | grep interruptHandler
400e302c W _ZN19ClocklessController...16interruptHandlerEPv
Fast memory ends well below that address. The handler is in flash-mapped memory,
as are the two functions it calls, and the linker map shows the emitted section is
a plain .text.<mangled name> rather than the .iram1 the attribute asks for.
These are static member functions of a template class. GCC gives such functions vague linkage so identical copies can be merged across translation units, and a function in a mergeable section cannot also be forced into an arbitrary named one. So the attribute is discarded. No warning, no error. It compiles, links, runs, and does nothing. That explanation started as a reading of the linked binary; we later put it on the compiler directly, four variants on this toolchain, in One interrupt into RAM.
The panic is the same fact from the other side. Ask the interrupt allocator for a fast-memory interrupt, it checks whether your handler is actually in fast memory, refuses, and the surrounding error check aborts. It was never mysterious. It was the system correctly reporting the thing nobody had checked.
Now the consequence. Because that interrupt is not registered as fast-memory safe, the framework disables it for the whole duration of every flash operation, along with both caches, on both cores. The ring holds 120 microseconds of output. A single flash page program is several hundred microseconds, an erase is tens of milliseconds, and at 60 frames per second the bitstream is going out for roughly 14 of every 17 milliseconds.
So: write to flash while the LEDs are running and the hardware replays its ring. Not rarely. Almost whenever the two overlap.
Two agents, and a disagreement worth having
This part ran as two investigations at once, one driven by Claude and one by ChatGPT. Separate worktrees, separate branches, one physical board between them, arbitrated by an exclusive lease. We wanted to know whether that buys anything beyond going faster.
It bought something specific, and it was not speed.
Both arms reached the finding above independently, off the same binary, in the same terms. Convergence like that is worth more than either arm's confidence, but it is not physical verification: the arms shared the source, the toolchain, and the board, so they could share a blind spot too. We treated the mechanism as a hypothesis until the artifact readback and the before/after wire captures below agreed with it.
Then they disagreed about where the fix belonged.
One arm wrapped the exclusion around the application's own settings-save function. Take a lock there, hold it across the frame, done. Against a deliberate trigger it looked convincing: 14 events down to 1, same stimulus.
Its steady-state control window said otherwise. With nothing being saved at all, just ordinary streaming, the failure still fired about once every ten seconds. That killed the premise the guard was built on. It assumed explicit saves are the only thing that touches flash, and something else was writing.
The other arm had put the exclusion one layer down, on the mutex the framework's own flash routine takes before it disables anything. Every flash user already goes through it: settings, partitions, reads as well as writes, updates, internal housekeeping, and callers that do not exist yet. That version took the steady-state rate to zero without auditing a single additional call site. It is the one we shipped.
The cost lands on the other side: a flash operation can now wait up to one frame, about 14 ms at 60 fps, for the show to finish. The LEDs do not care, because a WS281x pixel holds its last latched value until something clocks it again. What we checked on the shipped arm was frame rate and stream counters, which did not move; we did not separately soak the flash writers for latency or lock ordering.
Here is the asymmetry a single investigation could not have produced. The arm with the telemetry could see a residual it could not explain. The arm with the correct boundary could explain it but had no instrument that would have revealed it. Neither blind spot was visible from inside its own arm. And the arm that believed it had already finished was the one that was wrong, which is the dangerous direction for that error to run, because a fix that passes its own test retires the investigation.
Before and after, on the wire
With the cause known the bug stopped being rare, and that is the real result. A stimulus you can fire beats any amount of waiting.
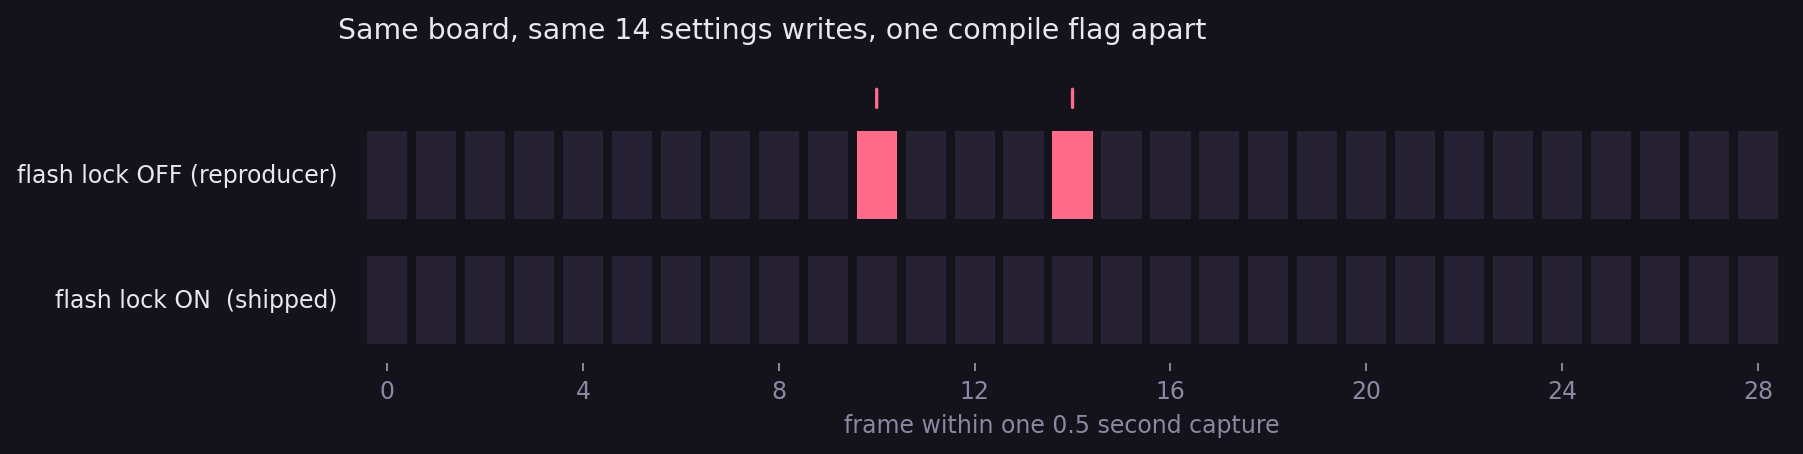
Same board, same 14 settings writes, one compile flag apart. Both captures 16 MHz, eight million samples, six lanes, both returning every sample requested.
| lock off | lock on | |
|---|---|---|
| frames differing from the held frame | 2 of 29 | 0 of 29 |
| exact splice found | yes | none |
| controller's own late-interrupt count | 70 | 1 |
| pixels it knows it replayed | 193 | 3 |
One footnote to that table: the on-demand run reproduced the same deterministic splice class, not the original event's exact length. Of the two dirty frames, one carried a clean four-pixel splice and the other a larger disturbance with no single clean insertion.
One detail is worth pointing at, because it is the thing most likely to mislead the next person. Five of the six lanes changed and one did not. That does not contradict a driver clocking all six in parallel out of one interleaved buffer. Every lane replayed the same interval; that lane's pixels simply held the same values across it. We fell for that misreading twice.
Every instrument lied at least once
None of the first answers were right, and each wrong one is now a check in the tooling. The current sensors reported 85 events in six minutes against an eyewitness rate of two or three an hour, which is a detector measuring itself. The first analyzer shot came back 100% dirty because the player had been stopped by another session, and a pole starved of frames renders its own animation instead, so every frame differs legitimately.
The worst one nearly shipped a false clean bill of health. Our first attempt at the "before" capture used a single HTTP request as the trigger and produced a completely clean wire on the build with the fix removed: 29 frames, all identical. The controller's own counters over that same period recorded 13 late interrupts and 39 replayed pixels. The bug had fired and missed the half-second window, because an HTTP round trip can consume most of it. A negative wire result is only as good as its stimulus timing.
Adding instruments did not make us more certain. It gave us enough independent views to catch the instruments being wrong, which is a different and better thing.
The residual, and the same lesson a third time
The flash cause is closed, with wire evidence on both sides. The fixed build still showed a residual: a replay every one to two hundred seconds depending on which record you read, one to four pixels each, from roughly 150 to 190 microseconds of blocking. Between two and eight times smaller than the eight pixels Spencer saw, usually below the four-pixel line the nightly gate watches but not reliably invisible, and for a while the obvious reading of the interval log was "scattered, therefore not a timer, therefore contention."
The interval log was scattered because we asked it the wrong question. The tool tested standard deviation on the gaps between late events, and only about one firing in twenty crosses the late threshold, so that test is guaranteed to return noise even for a metronome. Count the near misses alongside the late events and the metronome is unmistakable: 193 firings in 1,803 seconds, with every gap between late events an integer multiple of 10.0166 seconds. The raw count actually overshoots the grid, 193 firings against 180 slots in the window, a 7% bookkeeping gap we have not chased; the late-event gaps are the evidence that convicts. Third time in this investigation that the instrument, not the board, was the thing generating the confusion.
Ten seconds points at the heartbeat, and the heartbeat's version line calls
esp_ota_get_state_partition(), which reads otadata off flash. Every ten
seconds. On every board. Since that line shipped. So the residual was a flash
operation after all, which is exactly why it walked straight through a
flash-operation mutex. Two ten-second periodics existed in the firmware and the
first suspect, a DDP stats log line, was innocent; only an A/B that could switch
each one off independently told them apart. The image state transitions at most
once per boot, so latching the answer after the first read takes late events and
replayed pixels to zero across idle, DDP, and bigPacket windows.
What is genuinely still open is the mechanism question that raises: why a flash
read reaches the interrupt at all while showPixels() is holding the same
mutex. Sources: docs/DEVNOTES/2026-07-31-2-ten-second-grid.md and
2026-07-31-3-version-line-flash-read-convicted.md. The story continues in
One interrupt into RAM.
None of that hunt would have been affordable without instrumentation that went in before there was anything left to hunt. The controller counts late interrupts and the near misses that do not quite reach the threshold, converts the late ones into the number of pixels the hardware demonstrably replayed, and reports all of it over the network. Two integers polled over HTTP are what resolved the ten-second grid; the logic analyzer never came out of the drawer for it. The nightly hardware run fails if any single event reaches four pixels and reports smaller ones without failing, because a check that goes red every night for a known condition is a check nobody reads. Four is a judgment, not a measured perception threshold: the one event anybody actually saw was eight pixels, and the only other anchor is the four-pixel candidate we retracted at 8 MHz. Nothing here establishes that three pixels are invisible on other content.
What transfers
Verify placement in the linked binary, not in the source. Any attribute that
controls where code lands is a request, and the toolchain is allowed to decline
it silently. The map file was enough here because these symbols were weak and
global; it is not enough in general, since GNU ld maps omit internal-linkage
symbols entirely. nm on the ELF sees both.
An unexplained failure written down as a mystery is a strong signal that a nearby assumption is false. "You'll get a panic, and I'm not sure why" sat in that file for years, directly above the reason.
When you only see the tail of a process, do not test its intervals for spread. Test them for a common divisor. A metronome sampled at a five percent duty cycle has a huge standard deviation and integer-multiple gaps, and only the second of those two facts is telling you anything.
And build the control window to be the thing that can embarrass you. It is the only part of an experiment that can falsify your model of the mechanism rather than flatter it. Ours came back dirty twice when we expected it clean, and both times that was the whole result. The treatment window told us what we wanted to hear on the first try, and it was wrong.