
Replaying the wire: six looks in five seconds, decoded from a logic analyzer
Our bench could already measure frame rate, packet integrity, and pulse timing on the LED data lines, but nobody had ever looked at the colors those pulses spelled out. This post covers the afternoon that closed the gap: a decoder that keeps the pixel frames our metrics tool was already computing and throwing away, a replay page that plays captures back as animations, and a five-switch stress run through six looks that immediately caught the engine stumbling at every pattern change.
The check we did not have
The measurement chain for our poles ends at a generic FX2 USB logic analyzer, the kind that sells for about three dollars, clipped to the LED data lines. It has earned its keep: it settled the 60 fps bug hunt, and its numbers anchor the bit-timing post. By this week it could tell you frames per second, bits per frame, and whether every single pulse width was inside spec.
What it could not tell you is whether the pole was showing the right thing.
All of those metrics pass while the content is wrong. Swap the color order and red becomes green, with identical timing. Break the zigzag pixel map and the image scrambles, one legal pulse at a time. Replay a stale frame forever and the wire stays beautiful. Frame rate, integrity, and bit quality measure the carrier. None of them measure the message.
Spencer's framing: if we can take what the analyzer records, turn it back into an animation, and it looks like the pattern that was supposed to be playing, then everything about the output path is exercised at once, for that run. One check, whole chain.
The gap was thirty lines wide
Here is the part that made this an afternoon instead of a week. Thirty lines is the decoder delta, keeping frames instead of discarding them; the viewer around it was its own piece of work. Our metrics tool already decoded every frame to pixels. It had to: its sparkle detector (the single-bit corruption check from the 60 fps saga) compares each pixel against its neighbors across frames, so the tool reconstructs a 480 pixel by 3 byte array per frame, uses it for that one test, and throws it away.
bench_pixels.py is that decode with a memory. Same pulse classification,
same burst acceptance rules, which keeps it small and also means it inherits
the metrics tool's decoder failure modes along with its decoder, but each
frame keeps its bytes and its timestamp, and the result lands in a JSON file.
A static page, LEDscope, plays those files back: real wire timing, a scrubber
whose background is the whole capture rendered as a strip of color, and toggles
for the two transforms between wire order and what the eye should see (the GRB
byte swap and the zigzag map inverse). The capture this post is about is
playing here: one capture,
read-only, no sign-in. The tool itself, with the rest of our captures on it,
stays internal.
Two assumptions ride along with those transforms. The pole-texture view assumes our standard zigzag map at 480 pixels per lane, and the bytes are whatever reached the LED pins, after the firmware's gamma, brightness, and power-limit stages. This bench runs gamma 1.0, so engine bytes pass through untouched; a production capture or a custom map needs those stages accounted for, and wire order is the view that assumes nothing.
Before trusting it, we made it reproduce something we already believed. The
preserved reference capture from July 17 includes one frame that was decoded
by hand and archived: frame 161, 409 of 480 pixels lit, 1,632 one-bits, 2.69
seconds in. The new decoder produced exactly those numbers from the raw
binary, and across the whole capture it lands where the older tools already
were: 479 frames at 59.98 fps, matching analyze_capture.py, and a one-bit
fraction of 0.151 against the archived 15.6%. Only the hand-decoded frame is
an independent check; the rest is the decoder agreeing with its own parent.
Down at the wire level it agrees too:
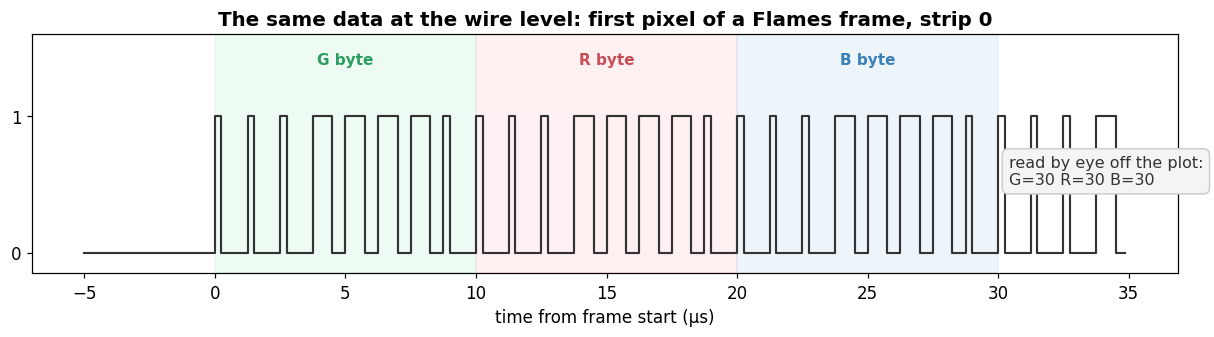
Those 24 pulses read by eye as G=30, R=30, B=30. The decoder's output for that frame, pixel 0: G=30, R=30, B=30.
Six looks in five seconds
A rainbow replaying correctly is necessary but not exactly a stress test, so the demo Spencer asked for was this: while the analyzer records, fire five pattern switches at the engine, fast, and watch the whole tour, six looks counting the incumbent, come back out of the wire.
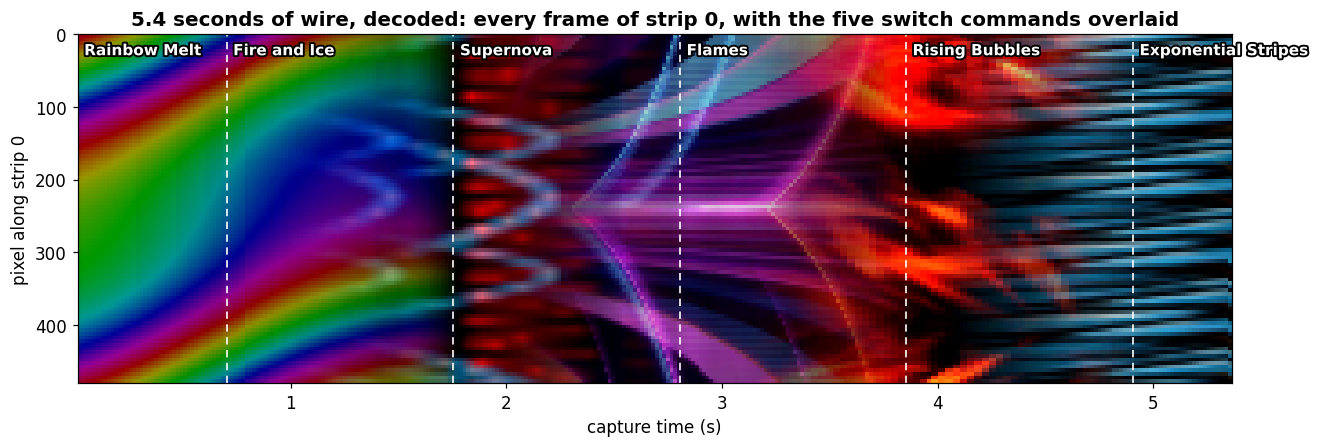
That image is nothing but wire data. Rainbow Melt is the diagonal banding on the left; each dashed line is the moment a switch command left the Mac; each new texture after a line is the next pattern fading in: Fire and Ice, Supernova, Flames, Rising Bubbles, Exponential Stripes.
Sending those switches turned out to be the fiddly part. The engine's
pattern selection is a Socket.IO event, and neither the Mac nor a login
shell on the Pi can import a Socket.IO client. It turns out you do not need
one: Engine.IO's long-polling transport is just HTTP. A GET for the
handshake, a POST of the string 40 to connect, a POST of
42["ui_event",...] per switch, a GET to collect replies. Forty lines of
urllib. The engine acknowledged every switch by name, and those
acknowledgements are archived next to the capture.
Each switch also carries a timestamp, converted to capture time by measuring how long the analyzer takes to start (a throwaway one-million-sample capture: 0.038 seconds, a one-off calibration good to tens of milliseconds, not a synchronized clock). Those are the dashed markers, and the viewer now draws them on the scrubber and names the active look while it plays:
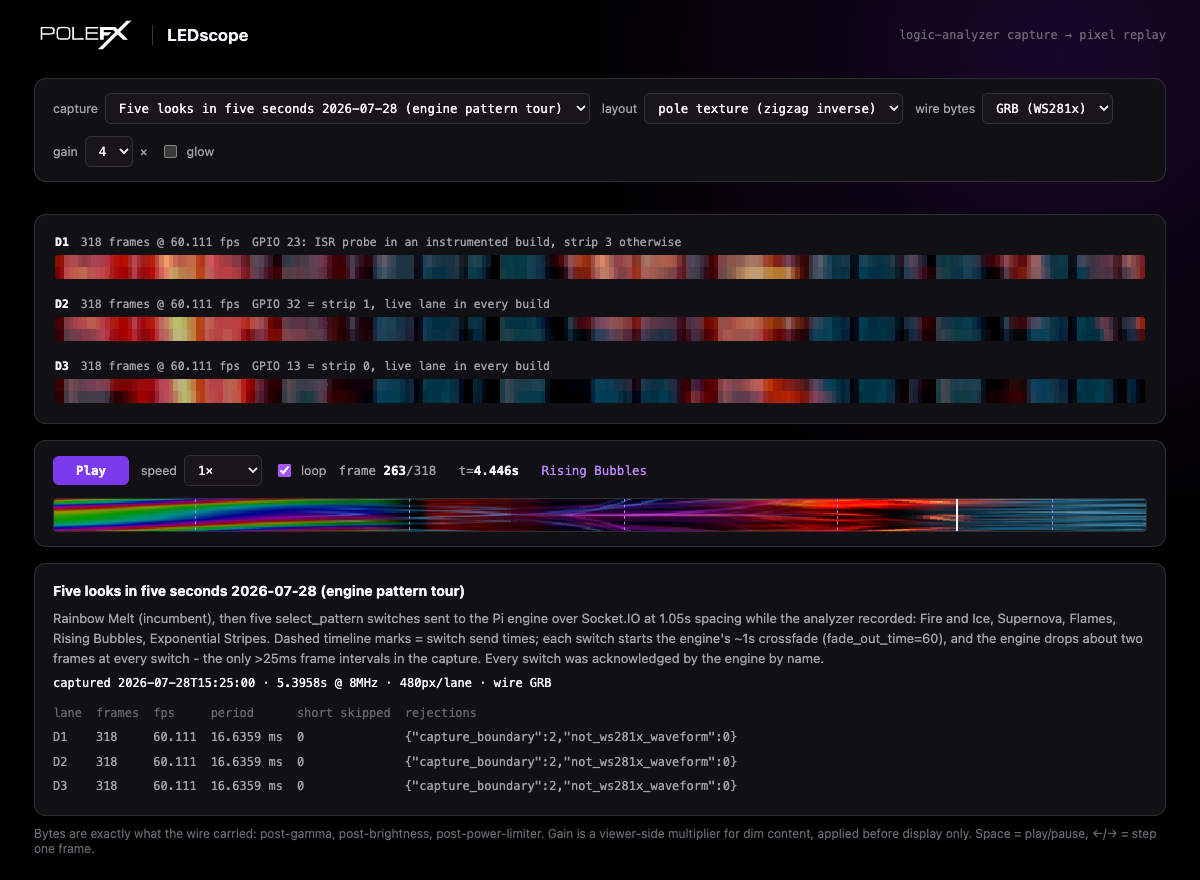
That is a screenshot of the live page; press play there and you are watching the wire.
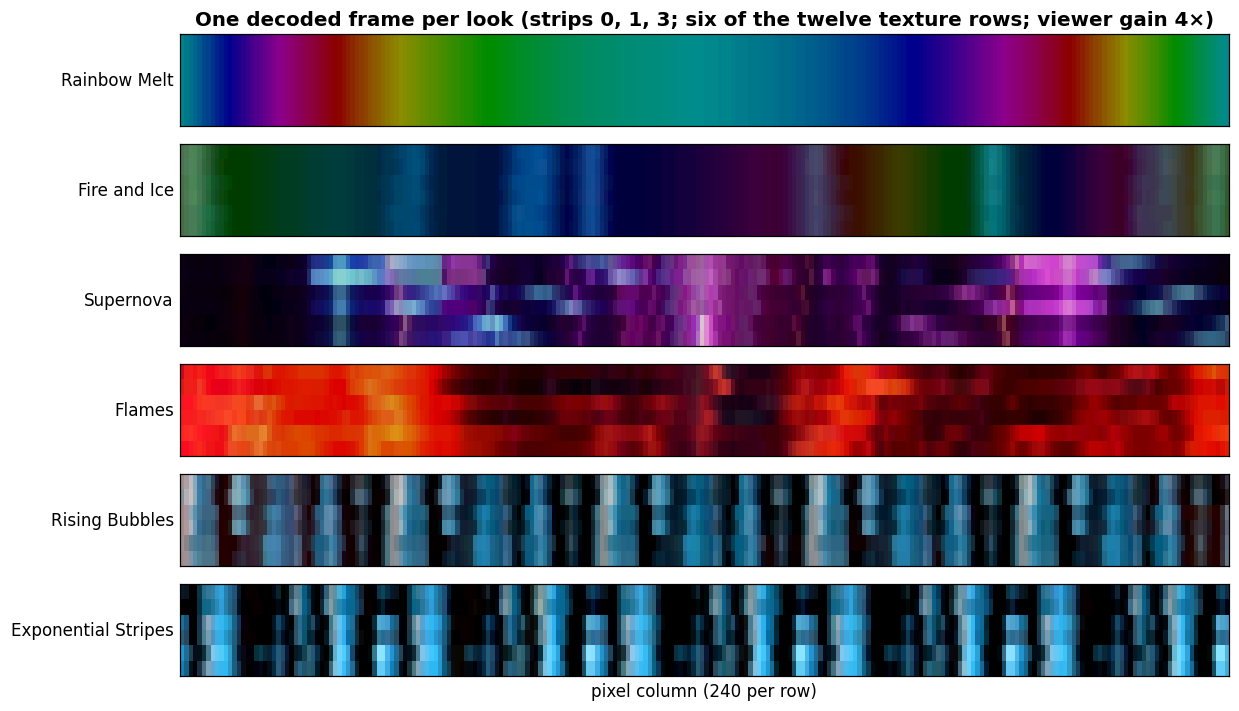
One caveat about the pretty pictures: with a one second crossfade and 1.05 seconds between switches, most frames in this capture are blends of two patterns. Here is one late frame from each of the six looks, as close to settled as the tour allows:
The thing nobody had seen
The first real payoff came out of the frame timing, not the colors.
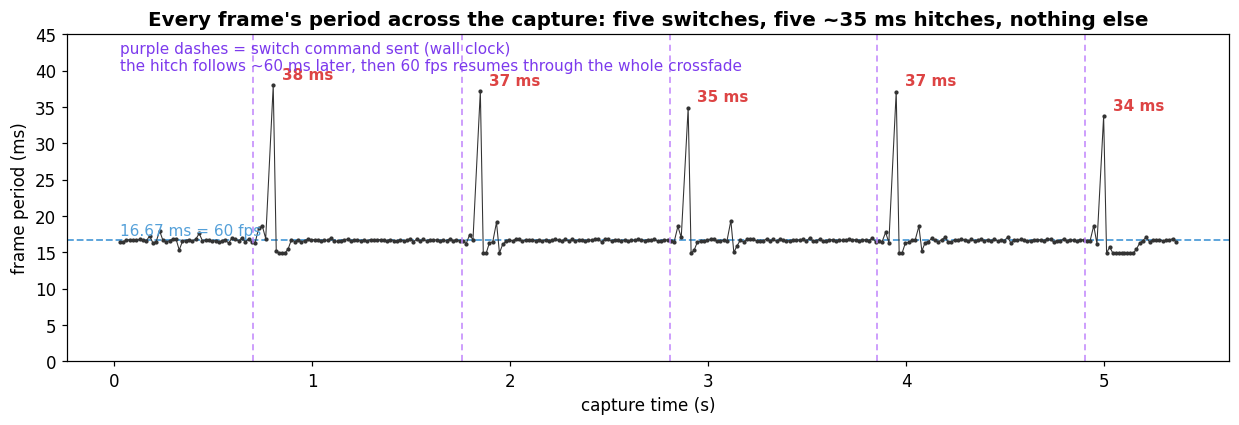
Steady state is a flat line at 16.67 ms. The only departures in the whole capture are five gaps of 33.7 to 38.0 ms, one per switch, each landing roughly 60 ms after its command, a figure no sharper than the tens of milliseconds the alignment is good for. The gaps are about twice the normal frame period. The wire measures the gap, not the scheduler's intent, so it cannot say whether that is two skipped frames or one skipped and one late; either way, every switch in this run bought a two-frame-period hitch. Not during the crossfade: blending two patterns runs at a clean 60 fps for a full second. The hitch rides on the switch itself. Five switches, one session, one crossfade setting is enough to name the thing, not to characterize it.
Nobody knew. It is invisible in every metric we had, because a 38 ms period once per pattern change moves no median and trips no integrity check, and nobody stares at a pole waiting for a two-frame stumble. It took lining up wire content against a command timeline to make it jump out. Whether it is worth fixing is a separate question (at a switch every second it is noticeable in aggregate; in normal use a pattern change is rare), but now it is a known number with a capture behind it instead of nothing.
The spikes bought us something else for free: alignment. The wall-clock markers and the wire's own hitches agree to about 50 ms with no clock synchronization anywhere.
What the analyzer ate on the way
Two runs died before the one you are looking at, and the cause is worth
writing down. Our analyzer has a documented habit of stopping early on long
captures. Today it was in a mood: ask for 12 seconds, get 6.2; ask for 8,
get 5.9. The exit code is 0 every time. The only evidence is a stderr line,
Device only sent N samples., and my capture script only read stderr on
failure, so the first two tours ended with the last pattern arriving after
the recording had quietly stopped. The fix: read stderr always, validate the
returned count on every capture, and size the next run to fit well inside the
window the device has actually been delivering that day, since you only learn
that window from the captures themselves. A short capture's numbers never get
reported as a complete run's. That is a workaround, not a repair: the run in
this post also came back short, 43.2 M samples against the 48 M asked for, and
it is only usable because all five switches fit inside what arrived. Nobody
has explained what the device is doing.
Where this leaves the bench
The output path now has a check at every level: pulse widths in spec, frames the right size at the right rate, and the content itself, which we can now replay and judge by eye, with command markers to line it up against intent. The capture, the markers, the acknowledgements, and the orchestrator script are all archived in the firmware repo, so the whole run reproduces from one command.
The loop we set out to close is closed for this run: on these lanes, through this map, at this gamma, the bits on the wire looked like the colors we meant. Looked like, by eye. Nothing yet compares decoded bytes against the engine's own frames, and that is the check this one is standing in for. What the tool changes is that the same look now exists for every capture after this one.